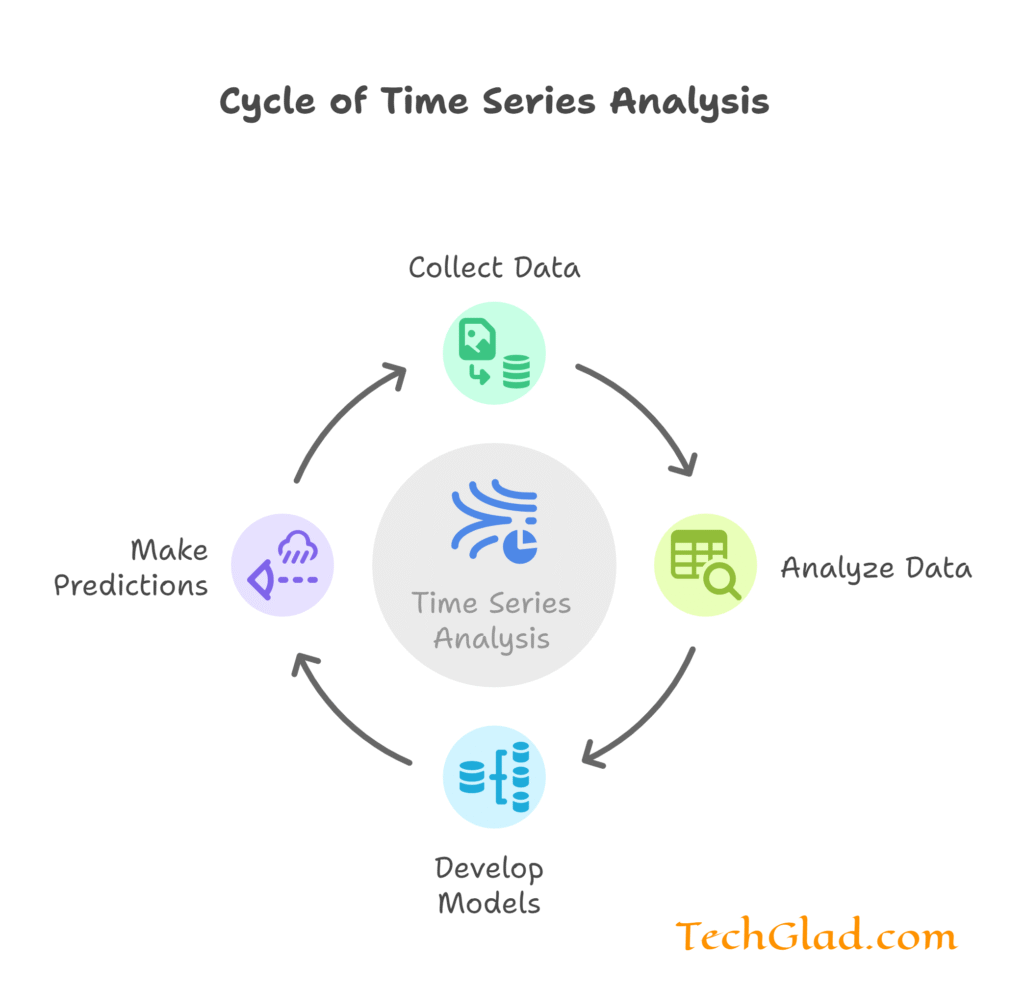
The critical ingredient of data science is the use of time series analysis in which meaningful information about data obtained through time is gathered. Time series analysis involves very powerful tools such as stock price forecasting, analysis of sales trends, and environmental change to understand and develop informed decisions concerning changes over time. We’re going to be talking about some very fundamental methods in time series analysis as well as some major applications and the value of unlocking meaningful information about that particular subject of data science in this blog.
Understanding of Time Series Analysis
A time series is a sequence of data elements recorded or collected at specified time points, usually of equal periods. Thus, time series analysis entails analyzing this type of sequence of data points for observing patterns of trend, seasonal variation, and other time-related characteristics. Hence, the goal is to create models that can express the underlying nature of the data and reasonably make predictions for future values. Understand how a data scientist and data analyst would analyze and perceive this data.

Key Techniques in Time Series Analysis
- Exploratory Data Analysis: this has to be performed prior to the use of sophisticated modeling. Exploratory data analysis is necessary for understanding the properties of a time series. Key steps of exploratory data analysis include visual inspection of data, pattern detection, and anomaly detection. The three most popular techniques of exploratory data analysis commonly used in time series are line plots, seasonal decomposition, and autocorrelation plots.
- Moving Averages: This is a technique for smoothing and helps in the removal of short-term fluctuations and the portrayal of longer-term trends in data. The simplest form is known as the simple moving average (SMA), where it is merely a calculation of the average of a fixed number of past observations. More sophisticated variants include weighted moving averages (WMA) and exponential moving averages (EMA), which weigh more recent observations more heavily.
- Decomposition: A decomposition of the time series decomposes it into constituent parts, mainly trend, seasonality, and residual or noise. Decomposition has two kinds:
- Additive Decomposition: A time series can be represented as a sum of trend, seasonal, and residual.
- Multiplicative Decomposition: A time series can be represented as the product of the trend, seasonal, and residual components.
Decomposition helps identify the underlying pattern of the series, providing insight as to how every contributing component can lead to this observed result.
- AR Model : AR Model is a type of model, from which a prediction about future values based on its own past values is made. Hence, the AR assumption takes place when the time series’ current value turns out to be a linear sum of past ones. An autoregression with order denoted as p refers to how many past values are used to form the projection.
- MA Models : Moving Average models use past errors in the forecasts to predict the future values of a time series. That is, the present value of a time series according to the MA model is the linear combination of previous errors. q represents the number of preceding errors in an MA(q) order.
Applications of Time Series Analysis in Data Science

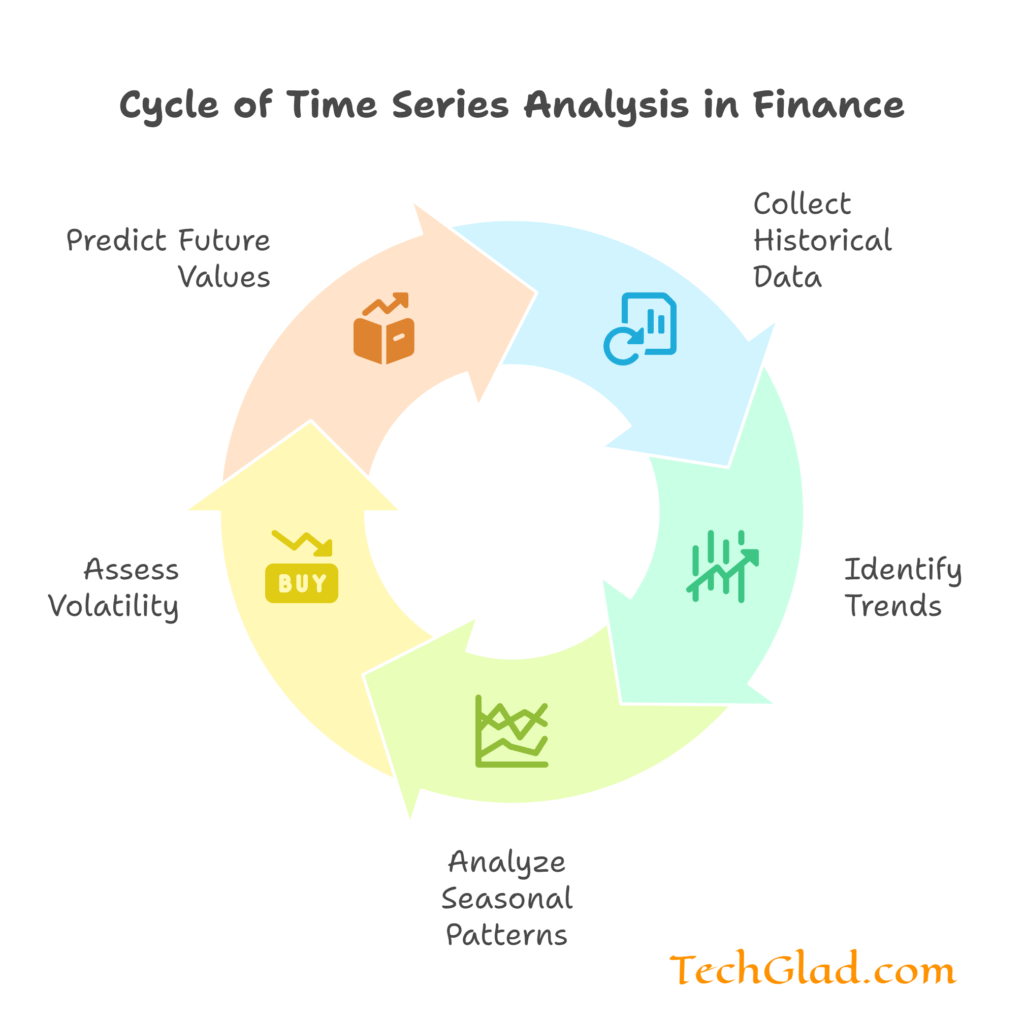
The field of finance applies this kind of time series analysis to predict stock prices, exchange rates, and other economic indicators. For example, financial analysts assess historical data for trends, seasonal patterns, and volatility.
Example: ARIMA is used for forecasting stock prices and market trends. Using historical price data and economic indicators, these models give future predictions for price movements and help investors in this regard to form trading strategies.
Sales and Demand Forecasting: The time series analysis is done by companies for sales and demand forecasting, optimizing the inventory levels, and a proper plan to produce. Accurate demand forecasting allows companies to optimize costs, improve customer satisfaction, and enhance operational efficiency.
For example, retailers utilize exponential smoothing techniques and ARIMA models to estimate seasonal sales patterns and plan stock levels. Then, the item will be readily available at a time when it is needed hence avoiding stockouts and excesses.
Environmental or Climate Monitoring : Time series analysis watches the change or pattern over a period. Thereby, an environmental research team can assess these environmental changes in the areas concerned with temperature, rains, or perhaps air quality or determine these impacts of climatic changes, to devise conservation means for the preservation of the environment.
For instance, climate scientists apply decomposition and state space models to understand long-term temperature trends and seasonal variations. This will help them understand the effects of global warming and predict future climate patterns.
Healthcare Analytics Healthcare Analytics Time-series analysis in Health Care Monitoring Patients Health Disease Preemptive Service Optimization of available resources Time stamp-based medical records to better optimize the outcomes by improving the overall public health.
Hospitals utilize time-series analysis for real-time monitoring and the detection of early warning signals that would enable healthcare organizations to take an early intervention by optimizing patient care.
Energy Demand Forecasting: Time series analysis is used to forecast energy demand and optimize energy production and distribution. Accurate energy demand forecasting helps utility companies balance supply and demand, reduce costs, and ensure reliable energy delivery.
For example, utilities use SARIMA models to predict energy demands in days and seasons. In turn, they prepare to create and distribute enough energy so as to prevent blackout situations and waste in energy consumption.
Anomaly Detection: This type of time series analysis helps identify anomalies or any kind of anomaly that happens with data. It is used in detecting fraud cases, equipment failure, and attacks by cybercrime.
For instance, banks use time series analysis to detect fraudulent transactions through unusual spending patterns. This is a way of preventing financial losses and protecting the accounts of customers.
Conclusion
Time series analysis is a strong technique in data science, helping to extract valuable insights from temporal data. Methods include moving averages, decomposition, ARIMA models, exponential smoothing, and state space models, through which data scientists find patterns that help in forecasting future values and undertaking decisions about domains.
Applications range from financial forecasting and sales planning to climate monitoring and healthcare analytics. With time series analysis, various applications can spur innovation and yield improved outcomes in any of these domains. As data science continues to grow, the integral part played by time series analysis will persist to help organizations tap into the potential of temporal data for complex problem-solving and objectives.
Whether you are a seasoned data scientist or just beginning, mastering time series analysis will equip you with the skills to navigate the dynamic landscape of data science and make meaningful contributions to your field. Staying on top of the latest advancements and best practices will unlock the full potential of time series analysis and drive success in your data-driven endeavors.


