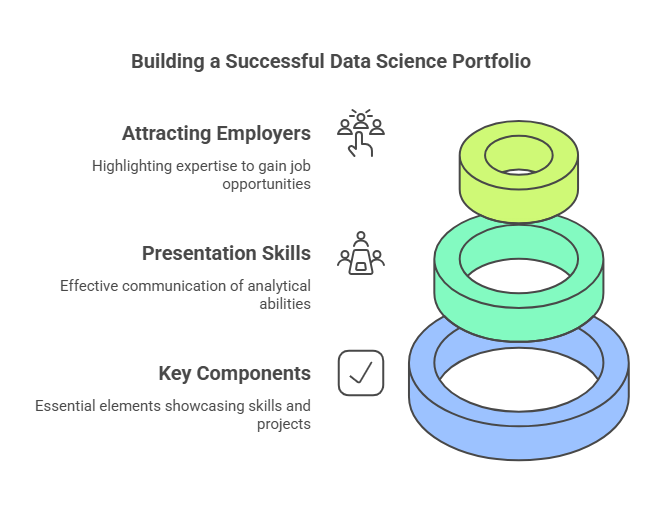
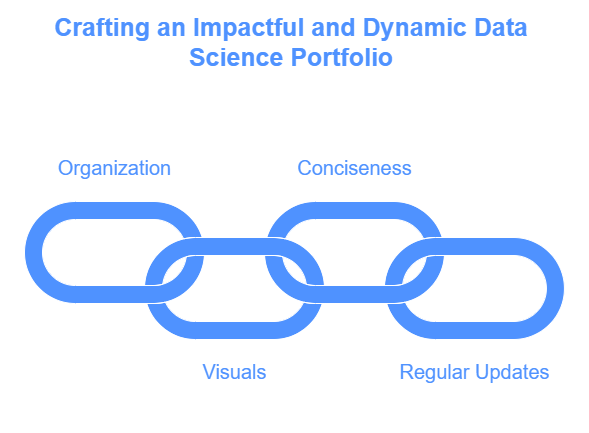
A standout portfolio is one of the most critical requirements in this rapidly evolving world of data science. It allows one to showcase his skills, unique approaches to solving data-related problems, and his level of expertise. This kind of portfolio demonstrates technical competency in delivering insights in an effective and creative manner. The following are key steps and tips for building a standalone data science portfolio:

Related: 7 Beginner-Friendly Data Science Projects You Can Try Today
Define Your Goals and Audience
You must define your goals and the audience you want to target before you start building your portfolio. The questions below will give you a better understanding:
- What roles do you wish to target as a data scientist, machine learning engineer, data analyst, etc.?
- Who will view your portfolio – hiring managers, clients, or other collaborators?
- What skills and experiences would you like to highlight?
In answering these questions, you will be able to tailor your portfolio to the expectations of your audience and to the aspirations of your career.
Choose Your Best Projects
The mantra in showing projects is quality over quantity. So pick a few that best represent your skills, creativity, and problem-solving abilities. Ideally, they would cover a good range of topics and techniques such as:
- Exploratory Data Analysis (EDA): Show the ability to analyze and visualize data in identifying patterns and insights.
- Machine Learning: Projects building and evaluating machine learning models should be included.
- Data Wrangling and Preprocessing: Demonstrate how you have cleaned and prepared the data for analysis.
- NLP: Highlight anything related to text analysis, sentiment analysis, or language modeling.
- Deep Learning: Provide at least two projects related to deep learning; the projects may include, but are not limited to, image classification, neural network models, etc.
Each project should clearly outline the problem you aimed to solve, the approach you took, the tools and techniques you used, and the results you achieved.

Record Your Projects in Detail
Documentation of your projects will make them easily understandable and impactful. Therefore, provide step-by-step explanation for each project, including but not limited to:
Introduction:
- Briefly state the project along with objectives.
- Explain why you would find this project interesting and of importance.
Data Collection and Cleaning:
- State what data sources were used along with how data were collected.
- Data cleaning and preprocessing steps in detail.
Exploratory Data Analysis (EDA):
- All visualizations, statistical analyses performed to try to understand what is in your data.
- Pointer interesting patterns/insights into the data.
Model Building:
- Describe the types of machine learning algorithms/models employed.
- Explain why you settled on these models and any hyperparameter tuning you performed.
Evaluation:
- Report the evaluation metrics you used for measuring the performance of your models.
- Compare various models’ performances and discuss any trade-offs.
Results and Insights:
- Summarize your findings along with the implications of your work.
- Discuss actionable insights or recommendations based on your analysis.
Challenges and Learnings:
- Reflect on the challenges you faced during the project and how you overcame them.
- Share any key learnings or takeaways from the experience.
Conclusion:
- Summarize the main points of your project and its significance.
- Mention any future work or potential extensions of the project.
Use Interactive and Engaging Visualizations
Visualization can explain complex data insights. This may include making an interactive dashboard in order to make your portfolio as lively and easily accessible as possible. It uses tools such as Plotly, Dash, or even Tableau. One may develop a more interactive dashboard or visualization for the purpose of incorporating it into a portfolio.
Examples of the visualization that can be done may be as follows:
- Scatter plots, bar charts, histograms: Such represents distribution and relationship within data.
- Heat maps: This would be useful in trying to visualize correlation patterns.
- Interactive Dashboards: Allows the end user to drill into your data and analysis to explore in greater detail.
Interactive visualizations enhance the appeal of your portfolio besides showing you master the use of visualization tools and libraries.
Showcase Your Technical Skills
Note the technical savvy applied when working on a project by referring to the following:
- Programming Languages: Python, R
- Libraries: Pandas, NumPy, SciPy, scikit-learn, TensorFlow, PyTorch, Matplotlib, Seaborn
- Data Visualization Tools: Tableau, Power BI, Plotly
- Databases: SQL, NoSQL databases (for example, MongoDB)
- Version Control: Git, GitHub
For each project, record the exact tools and technologies you used and describe how they were helpful in completing your work. This helps any future employer or collaborator have a clear sense of your technical expertise.
Develop a Professional Online Presence
A professional online presence can significantly increase the visibility and impact of your portfolio. Here are some platforms and tips to consider:
GitHub:
- Host your code and projects on GitHub, making it easy for others to access and review your work.
- Write detailed README files for each repository, including project descriptions, instructions for running the code, and dependencies.
Personal Website or Blog:
- Create a personal website or blog to present your portfolio, share your insights, and write about data science topics.
- Use GitHub Pages, WordPress, or Jekyll to set up your website.
LinkedIn:
- Update your LinkedIn profile to reflect your skills, experiences, and projects.
- Share posts and articles about your work and engage with the data science community.
Kaggle:
- Participate in Kaggle competitions and share your notebooks and kernels.
- Get badges and build your reputation within the Kaggle community.
An easy online presence to access will facilitate easy discovery of and assessment of your work by potential employers, clients, or collaborators.
Network and Collaborate
Networking and collaboration are considered the pillars that help to get a career ahead in data science. One has to engage with data science communities; attend conferences, join online forums, and meet local meetups where one gets collaboration opportunities.
There are several ways to network and collaborate including:
- Online communities: One must join data science communities on Reddit, Stack Overflow, and Data Science Central.
- Meetups and Conferences: Attend local data science meetups and industry conferences to meet like-minded professionals and learn about the latest trends.
- Open Source Contributions: Contribute to open-source projects on GitHub to showcase your skills and collaborate with others.
- Hackathons: Participate in data science hackathons to work on real-world problems and network with other data scientists.
Conclusion
Building a standout data science portfolio requires careful planning, thoughtful project selection, and effective communication of your skills and insights. As demonstrated in the previous discussion, defining goals, selecting a few among your assignments, documenting properly, brightening up visuals along professionalism at social networks have made this portfolio strong to tell the expertise uniquely to draw distinctions between all and anyone’s profiles.
Among these, in every respect networking amongst professionals also brings collaboration into focus and makes continual learning requirements active or to get updated to be very up-to-date for the people practicing data science today. It requires effort and dedication, but you can build some compelling data science portfolio work that opens doors to exciting possibilities and shows your value as a successful data scientist.


